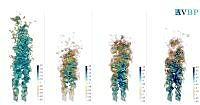
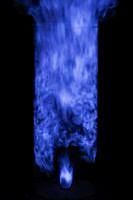
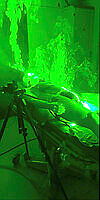
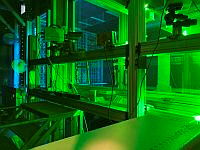
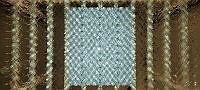
In this picture, we see data visualization of direct numerical simulations of premixed ammonia/hydrogen flames done using the CFD code AVBP. The color legend corresponds to the normalized heat release rate of the four flames that have different ammonia/hydrogen content in the fuel, and different equivalence ratio. The amount of hydrogen increases from left to right, and the equivalence ratio increases from right to left.
The work was performed with Thierry Poinsot, Davide Laera, and Victor Coulon, researchers from CERFACS lab at Toulouse, France. Corinna Netzer and Terese Løvås from NTNU also supported this work.
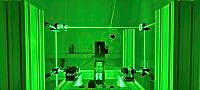
Photo: Jessica Gaucherand/NTNU
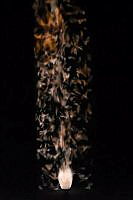
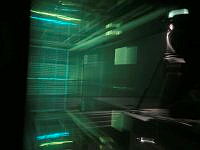
In this picture, we see data visualization of direct numerical simulations of premixed ammonia/hydrogen flames done using the CFD code AVBP. The color legend corresponds to the normalized heat release rate of the four flames that have different ammonia/hydrogen content in the fuel, and different equivalence ratio. The amount of hydrogen increases from left to right, and the equivalence ratio increases from right to left.
The work was performed with Thierry Poinsot, Davide Laera, and Victor Coulon, researchers from CERFACS lab at Toulouse, France. Corinna Netzer and Terese Løvås from NTNU also supported this work.
Photo: Jessica Gaucherand/NTNU

.jpg.sSeL6NmDMgMhPaljkAMA.zSpGS_oZ7e.jpg)

.jpg.sSeAt9mDMn8FC6djkAMA.QIOYvhSkiq.jpg)