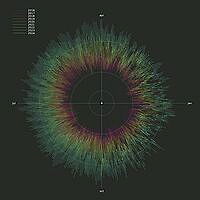
""Rise of Renewables" – The share of renewable* power in the European** generation mix.
This time series is illustrated using polar coordinates — a helpful visualization for examining recurring seasonal patterns and long-term trends. Starting from January on the right, the time series loops counterclockwise around the circle, representing the full year. It shows nine years of data observed on hourly basis. Concentric reference lines are shown at 10%, 25%, and 50%.
The plot reveals daily spikes, weekly fluctuations, seasonal peaks, and an overall increase in renewable share in recent years compared to earlier ones.
Research and practices on renewable power technologies, energy efficiency and flexibility, energy economics, and quantitative sustainability analysis are among the key enablers of the transition toward renewable-dominated — and therefore greener — power systems.
* Renewable sources considered: biomass, geothermal, hydro, solar, wind, marine.
** Includes 36 countries participating in the European Network of Transmission System Operators for Electricity (ENTSO-E).
Data source: ENTSO-E Transparency Platform (https://transparency.entsoe.eu/)." Ill. by Ruslan Zhuravchak. Bidrag til NTNU EPTs fotokonkurranse for 2025.
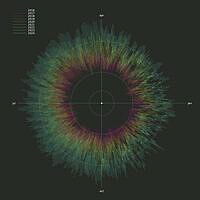